|
How to use embedded Visual Feedbacks |
  
|
|
How to use embedded Visual Feedbacks |
  
|
This component's version comes with the four embedded Visual Feedbacks listed below:
These Visual Feedbacks, through the call to the respective Create methods, need to be associated to an existing window that will be used as a surface for the graphic rendering; for this purpose we suggest the use of a Label control.
IMPORTANT NOTE: Visual feedbacks are not available when the recording session is performed through a queue (StartFromQueueRaw method) or through an Internet URL (StartFromUrl or StartFromYoutube methods).
|
Implemented through the VUMeter class and accessible through the DisplayVUMeter property, must be created through a call to the VUMeter.Create method and can be shown/hidden at any time through the VUMeter.Show method. This object exposes the following properties and methods that allow the customisation of the graphic rendering:
BandType: determines if the VU Meter will be a mix of the Left and Right channel or if each channel will have a dedicated "band" (default).
HasPeaks: determines the "peaks" visibility.
ColorBands: determines the "bands" color.
ColorPeaks: determines the "peaks" color.
ColorBackground: determines the color of the background area.
ZoomPerc: determines the height zoom percentage of bands.
SetBackPictureFromFile: sets a background picture obtained from a BMP file
SetBackPictureFromHandle: sets a background picture obtained from a bitmap handle
below you can see a sample of the embedded VU-Meter:
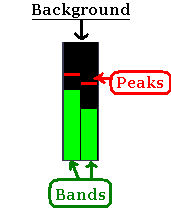
If you shouldn't like the graphic representation of the embedded VU-Meter, note that you can implement your own VU-Meter graphics, driven by the values received through the CallbackVuMeterValueChange delegate.
Implemented through the Spectrum class and accessible through the DisplaySpectrum property, must be created through a call to the Spectrum.Create method and can be shown/hidden at any time through the Spectrum.Show method.
IMPORTANT NOTE: By default the spectrum analyzer will analyze the sound incoming from input channels without keeping count of eventual filters, equalizer or custom DSP effects applied to the incoming audio stream. The spectrum analyzer can keep count of these effects through the EffectsOnSpectrumEnable method.
|
This class exposes the following properties and methods that allow the customisation of the graphic rendering:
BandWidth: determines the width in screen pixels of the "bands".
HasPeaks: determines the "peaks" visibility.
ColorBands: determines the "bands" color.
ColorPeaks: determines the "peaks" color.
ColorBackground: determines the color of the background area.
ZoomPerc: determines the height zoom percentage of bands.
SetBackPictureFromFile: sets a background picture obtained from a BMP file
SetBackPictureFromHandle: sets a background picture obtained from a bitmap handle
below you can see a sample of the embedded Spectrum and, on the right, a zoomed detail of the Spectrum "bands":
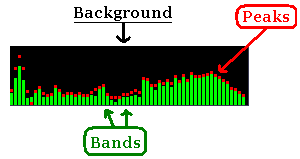
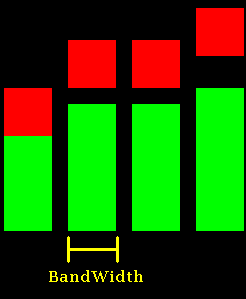
If you don't like the graphic representation of the embedded Spectrum, note that you can implement your own Spectrum graphics, driven by the values obtained through the Spectrum.GetTable method which can be called after the CallbackVuMeterValueChange delegate is invoked.
A graphically enhanced version of the spectrum analyzer can be obtained by leveraging the SpectrumEnh object: see the related tutorial for details.
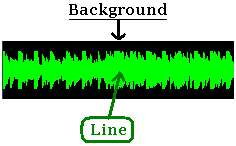
Implemented through the Oscilloscope class and accessible through the DisplayOscilloscope property, must be created through a call to the Oscilloscope.Create method and can be shown/hidden at any time through the Oscilloscope.Show method. This class exposes the following properties and methods that allow the customisation of the graphic rendering:
LineWidth: determines the "line" color.
ColorLine: determines the "line" color.
ColorBackground: determines the color of the background area.
Type: determines the type of drawing used to render the line.
ZoomPerc: determines the height zoom percentage of the line.
SetBackPictureFromFile: sets a background picture obtained from a BMP file
SetBackPictureFromHandle: sets a background picture obtained from a bitmap handle
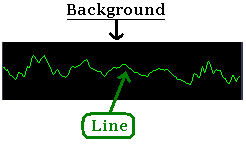
below you can see a sample of the embedded Oscilloscope:
Implemented through the Waveform class and accessible through the DisplayWaveform property, must be created through a call to the Waveform.Create method and can be shown/hidden at any time through the Waveform.Show method. This class exposes the following properties and methods that allow the customisation of the graphic rendering:
Resolution: determines how frequently vertical lines are drawn on the screen (by default every 30 milliseconds).
ColorLine: determines the "lines" color.
ColorBackground: determines the color of the background area.
ZoomPerc: determines the height zoom percentage of waveform's lines.
SetBackPictureFromFile: sets a background picture obtained from a BMP file
SetBackPictureFromHandle: sets a background picture obtained from a bitmap handle
below you can see a sample of the embedded Waveform display:
